Week 10 — Interactive Fiction, Twine, and Procedural Storytelling
This week introduced interactive fiction and Twine as a platform for
building multilinear stories. We explored how hyperlinks, branching choices, and
conditional logic transform a narrative into an interactive system rather
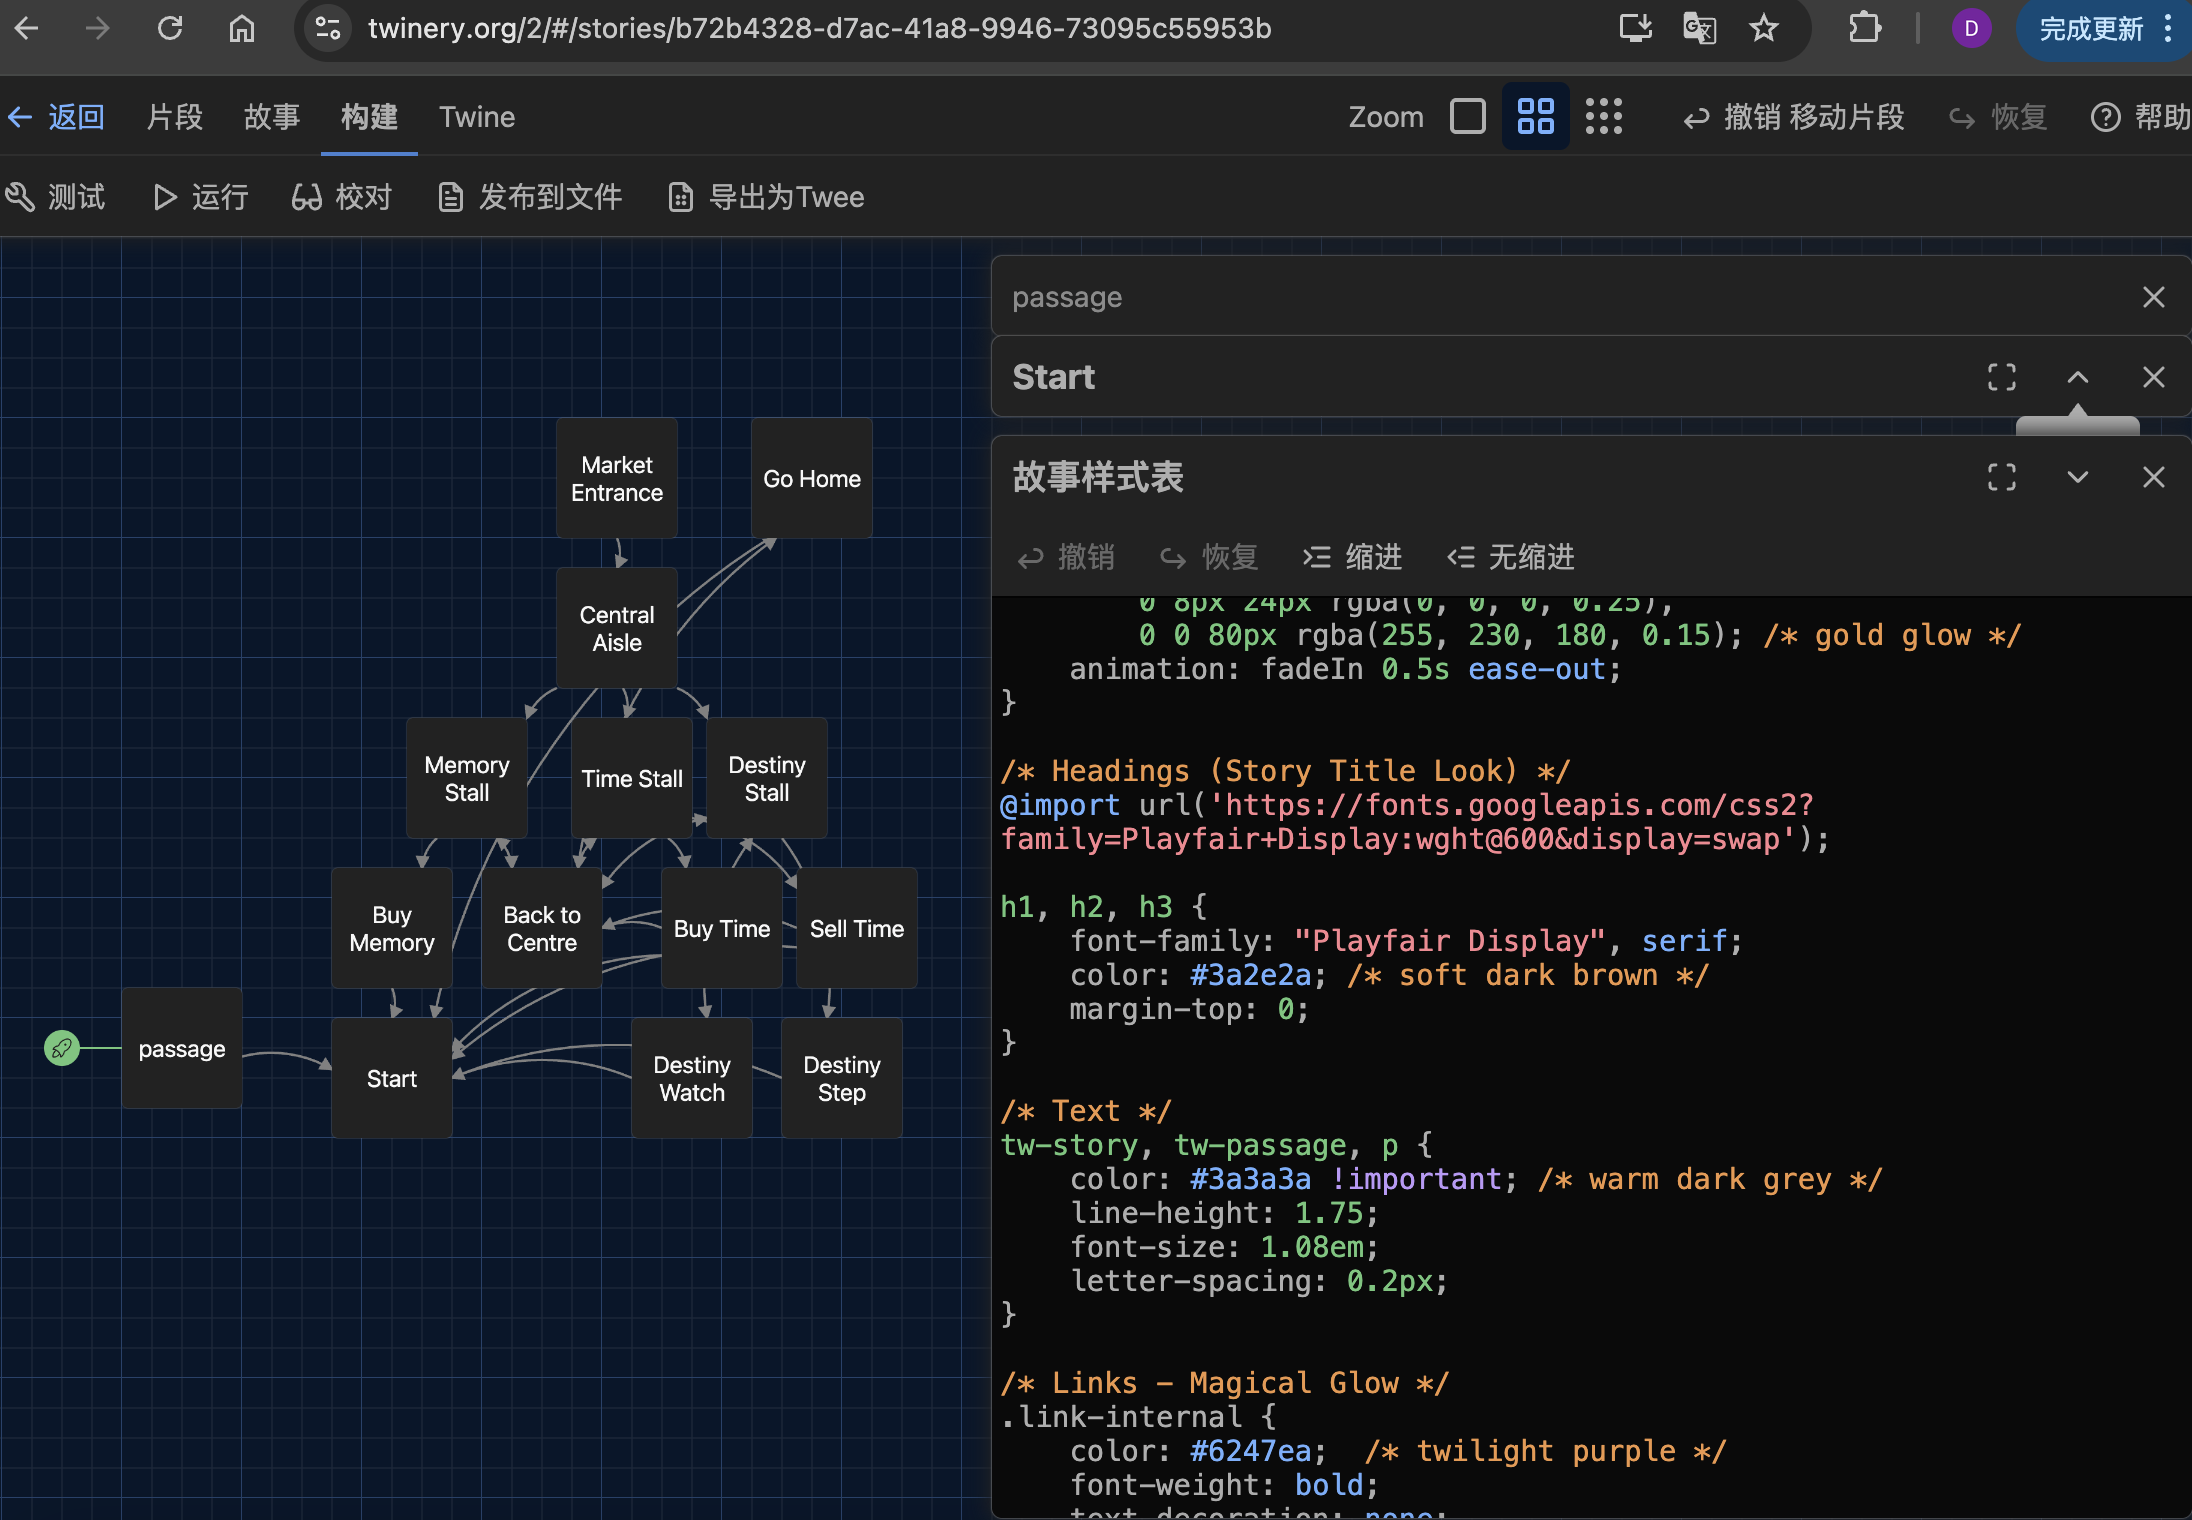
than a static text. Twine allowed us to prototype story structures for our Kirkgate
Market project while experimenting with mood, pacing, and player decision-making.
Through hands-on work, I learned how the writer becomes a system designer: every
link, variable, and passage frames what the reader can and cannot do. Twine makes
visible how narrative is organised procedurally, not just linguistically.
Reflection:
This week helped me understand interactive stories as a form of
procedural rhetoric—the argument is made through structure, choice,
and consequence, not only through words. Designing my own Kirkgate Market story
made me confront how agency is always crafted: players feel free, but their
freedom is shaped by the pathways I author. This revealed the politics of
interactive design and the responsibility of structuring meaningful choices.
I now see Twine as a cybertext environment where narrative emerges from the
negotiation between system logic and player imagination.
Figure. Visualising the multicursal structure of my Twine interactive story.
interactive fictionprocedural rhetoric
Week 9 — Creative Hacking, Senses and Bodies
This week we were introduced to creative hacking through the
Arduino environment. Working in the Helix space, we built the “Love-O-Meter”
circuit from the Arduino classroom kit, using a temperature sensor, LEDs and a
microcontroller to measure changes in our body temperature. The workshop showed
how simple hardware, code and sensors can be combined to engineer a small
human–body sensing system.
As we uploaded the example code, read serial data and watched the LEDs respond,
we saw how the body is translated into digital data: analogue
voltage becomes numbers, thresholds, and visual feedback on screen. The task
didn’t always work perfectly, but the glitches and errors were part of learning
how creative hacking operates as an experimental, improvisational method rather
than a polished engineering pipeline.
Reflection:
This workshop helped me connect embodied experience with datafication. Feeling my
own skin temperature while seeing the Arduino plotter update made it clear that
“the body” in digital systems is always a mediated construction—what counts is
what the sensor can read and the code decides to display. Creative hacking framed
making and tinkering as a critical practice: by wiring, debugging and adjusting
the Love-O-Meter, I started to question how other sensing systems (wearables,
health apps, surveillance devices) also measure, normalise and classify bodies in
everyday life.
Video. Experimenting with Arduino-based body sensing in Week 9.
creative hackingsensing the body
Week 8 — Digital Ecologies at Kirkgate Market
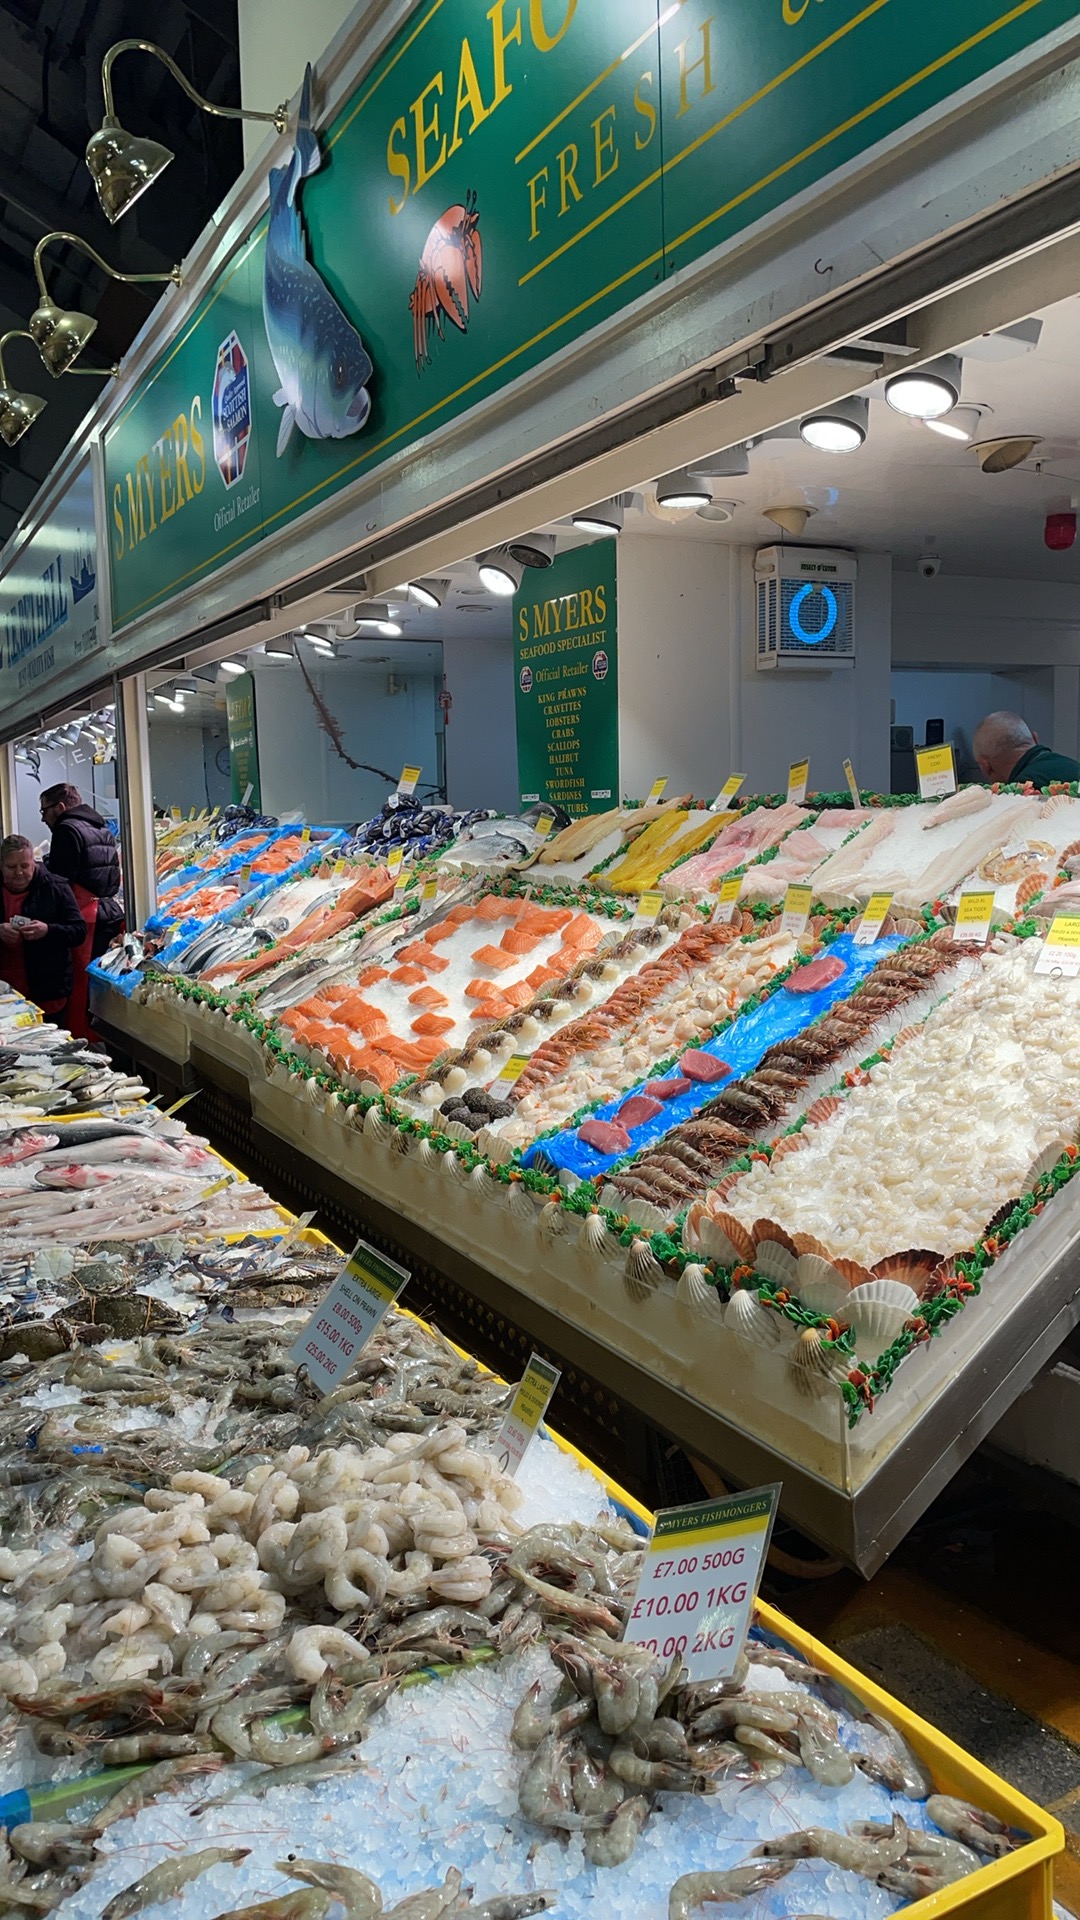
This week we worked with digital ecologies at Kirkgate Market, using
our bodies and senses to explore human–food relations. Guided by Turnbull et al.
(2024), we approached the market as a dynamic ecology of humans, foods, materials,
infrastructures and data, rather than just a shopping space. In groups we followed
our senses — sight, smell, touch, sound and even taste — while documenting stalls,
ingredients and atmospheres through photos, audio, and notes on our phones.
We also discussed entanglement (Barad) and more-than-human
worlds (Abram), imagining the wider multispecies and labour networks behind each ingredient.
This made visible which foods, bodies and stories are amplified or marginalised within the
market’s mediated environment.
Figure. Sensory exploration at Kirkgate Market — observing textures, colours, and multispecies entanglements.
Reflection:
This week reframed Kirkgate Market for me from a familiar everyday space into a
more-than-human digital ecology. Using my phone as a sensing device made me
aware of how digital mediation both amplifies and filters what I notice: some sounds,
colours and textures become data, while others fade into the background. Thinking
with entanglement helped me see foods not as isolated objects but as nodes in a web
of landscapes, workers, species and technologies. The workshop showed me that
“doing digital practice” can mean cultivating situated, ethical forms of attention,
not just collecting content.
digital ecologiesmore-than-human
Week 7 — AI, Identity, and Negative Prompting
This week we examined how generative AI models construct and reproduce identities
through patterns in training data. The workshop introduced negative prompting
as a method for uncovering hidden biases—by asking the model what something is
not, we reveal the assumptions embedded in its representational logic.
Through a series of AI tasks, I learned how prompts do not simply retrieve
information but actively shape identity categories. The AI’s responses reflected
broader cultural assumptions about gender, race, ability, and class, showing how
computational identity is produced through statistical associations rather than
lived experience.
Reflection:
Negative prompting made visible the defaults that AI systems rely on,
the stereotypes they normalise, and the exclusions built into their training data.
I realised that AI does not “mirror” identity—it performs identity through
prediction, compression, and categorisation. This highlighted the politics of
generative models, where representational harms can emerge even from seemingly
neutral prompts.
AI Identity Pipeline
1. Data traces
Clicks, searches, dwell time, location and behavioural metadata are collected as
raw signals about the user.
➜
2. Model patterns
These signals are compared with patterns learned from training data to identify
statistically similar behaviour profiles.
➜
3. Predicted identity
The system outputs identity labels and assumptions such as “student,” “interested
in AI,” or “frequent online shopper.”
➜
4. Platform actions
These predictions influence recommendations, ads and content feeds, shaping how
users see themselves — a form of “computational experience.”
Figure. The AI identity pipeline illustrates how platforms move from raw data traces
to predictive identities and behavioural shaping.
AI identitybias & representation
Week 6 — Algorithmic Identity
This week’s workshop explored algorithmic identity (Cheney-Lippold, 2017):
the idea that who we “are” online is continually produced by the data we generate and the
classifications applied to us by platforms. We worked through three steps — Input, Output,
and Process — to understand how platforms see us, how they classify us, and how categories
shape our experiences online.
Task 1 – INPUT: I listed the types of data I share, intentionally and
unintentionally, on my most-used platforms, including:
Content I upload
Demographic data
Location data and search queries
Browsing behaviour and engagement patterns
Biometric or device-level data
Reflection: I realised that even when I am not actively posting,
platforms still generate data about me through log files, tracking pixels and metadata.
Task 2 – OUTPUT: I checked how Google and other platforms categorise me
in their ad settings dashboards, revealing labels such as “Parents of toddlers” that do not
match my real life.
Reflection: These categories show how platforms simplify complex identities
into a few data-driven labels. Some of them made sense, while others felt inaccurate or overly
general, reminding me that these labels are operational hypotheses rather than truths.
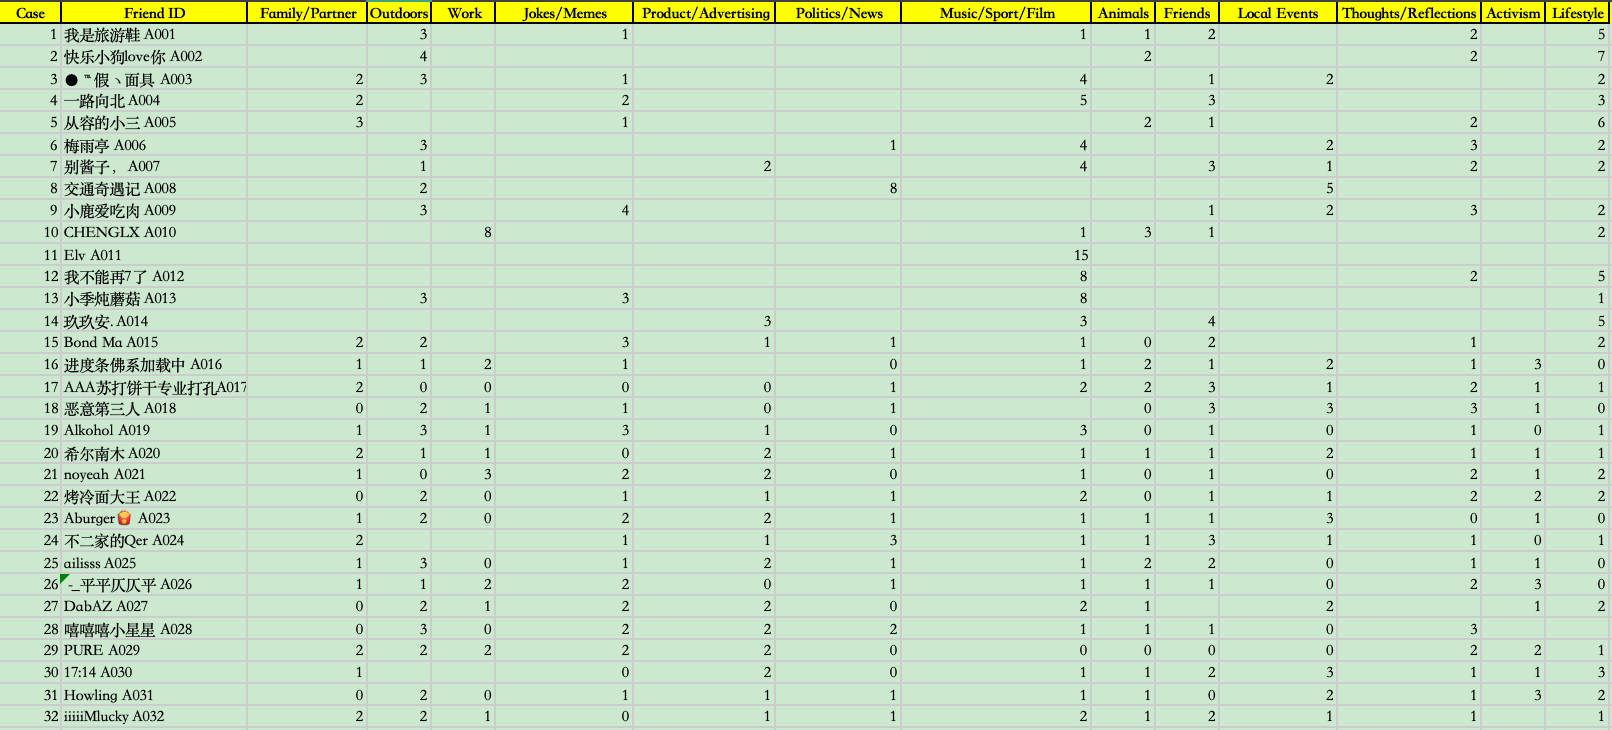
Task 3 – PROCESS: To “un-black-box” the categorisation process, I applied
David Sumpter’s 13-category model to manually classify 32 friends × 15 posts each.
Figure. Manual classification using Sumpter’s 13 categories.
Reflection: I realised how subjective manual classification is. Many posts
could fit multiple categories, but I had to force them into only one. This raised questions
about how platforms interpret far more complex data at scale using rigid taxonomies.
🌟 Overall, I learned that algorithmic identity is not a fixed description but a dynamic
construction shaped by data traces, platform logics, and predefined categories.
algorithmic identityclassification
Week 5 — Data Visualisation and the Politics of Seeing
This week we moved from designing datasets to visualising them. Using the numerical
data we had created in Week 4, we experimented with different chart types —
bar charts, distributions and comparisons — to see how each form highlights or
hides particular patterns. I learned that visualisation is not a neutral translation
of numbers into images, but a design practice that frames how data becomes
knowable.
Reflection:
Working with charts made me realise how easily visual choices can steer
interpretation. As D’Ignazio and Klein argue, data visualisation often performs
authority while obscuring the labour, uncertainty and exclusions behind the data.
Seemingly small decisions — where to cut the y-axis, how to group categories,
which colours to emphasise — can exaggerate tiny differences or flatten important
variations. This week taught me to read charts critically and to see
visualisation as a site of representational power, not just technical skill.
Tiny demo: the same numbers can feel very different
Animated mock-up: the three bars stand for three design choices. The underlying
values do not change, but the sense of difference does. This echoes the week’s
lesson that data visualisation always involves aesthetic and political decisions,
not just neutral display.
data visualisationrepresentation
Week 4 — Data, Power, and Designing a Dataset
This week we explored how data is never neutral but shaped by social, political,
and epistemic assumptions. Through a feminist data lens, we examined how
“the way data is understood, captured, and classified is an act of world-making”
(Crawford, 2021). Our group designed a numerical dataset about how university
students use generative AI in their daily study, which made me more aware of how
variables, measurement choices, and omissions construct particular representations
of student behaviour.
Reflection:
I realised that creating a dataset is not simply a technical procedure but a
methodological and ethical act. Choosing what to count—and what remains uncounted—
revealed structural biases and data gaps (Gitelman & Jackson, 2013). The exercise
highlighted how power operates through datafication.
dataficationfeminist data
Week 3 — Data and Data Analysis
This week we learned how data collection and analysis can reflect power relations and
ethical choices in research. We explored feminist approaches to data and discussed how
datasets can both represent and shape the world. In groups, we designed surveys to collect
numerical data — my group focused on how university students use generative AI tools in
their daily study. This activity helped me understand the importance of ethical design,
consent, and potential data gaps when gathering information.
data collectionAI research
Week 2 — Understanding Web Scraping
This week we learned how web pages can be understood as structured data and explored the
concept of web scraping — extracting information from online sources for
research. We inspected website code using browser tools and tried scraping examples with
tools such as OutWit Hub, WebScraper.io, and ScrapeHero. I now understand how HTML structures
enable data collection, and how these tools can support digital media research.
web scrapingdigital methods
Week 1 — First Steps
We started our digital practice journey by installing Phoenix Code and FileZilla.
I learned how to edit a basic HTML page and upload it to my Leeds New Media web space.
It was my first time building something that can go online.